Enjoy the experience of our restaurant.
Register to know our latest news.
Lorem ipsum dolor sit amet, consectetur adipiscing elit, sed do eiusmod tempor incididunt.
Lorem ipsum dolor sit amet, consectetur adipiscing elit, sed do eiusmod tempor incididunt.
Lorem ipsum dolor sit amet, consectetur adipiscing elit, sed do eiusmod tempor incididunt.
Lorem ipsum dolor sit amet, consectetur adipiscing elit, sed do eiusmod tempor incididunt.
Steve Scranton
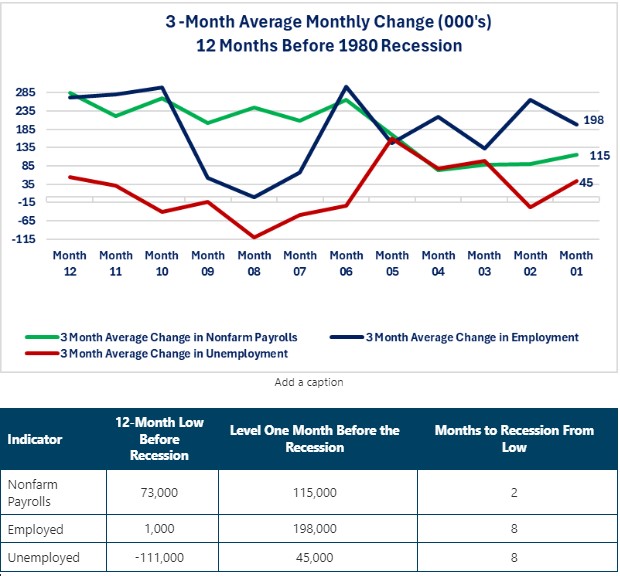
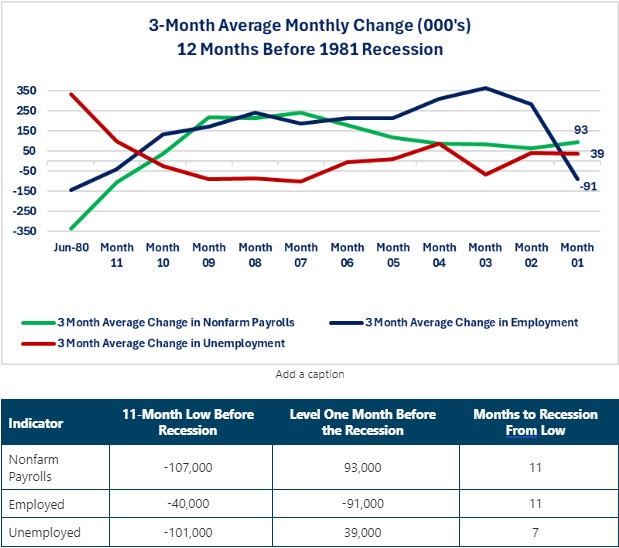
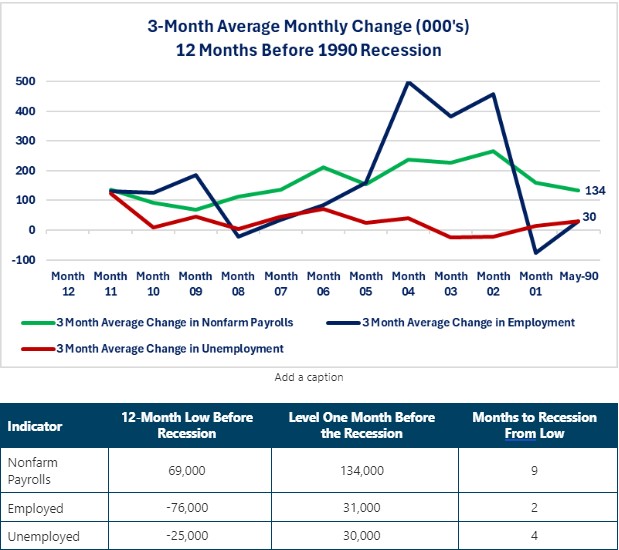
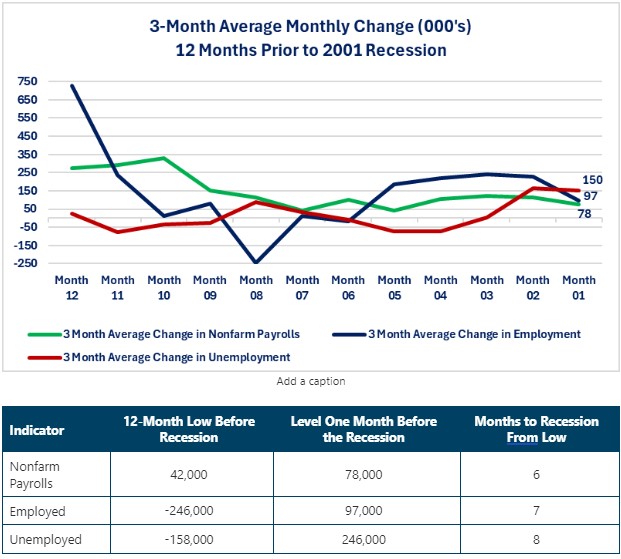
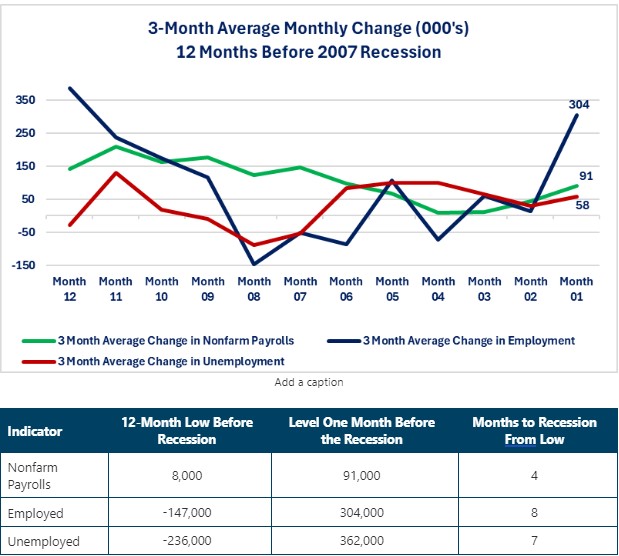
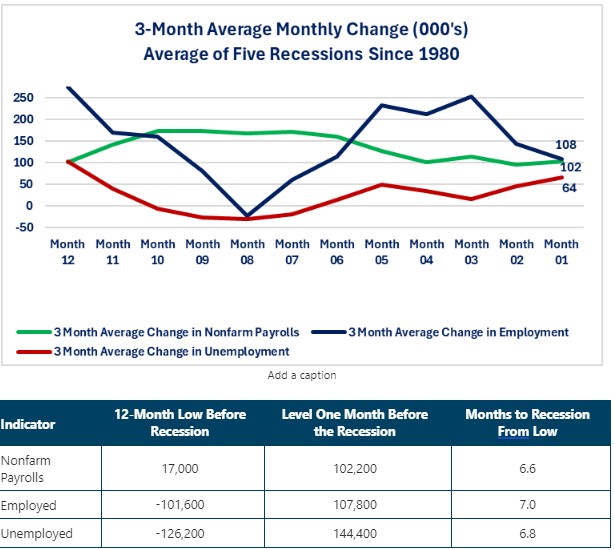
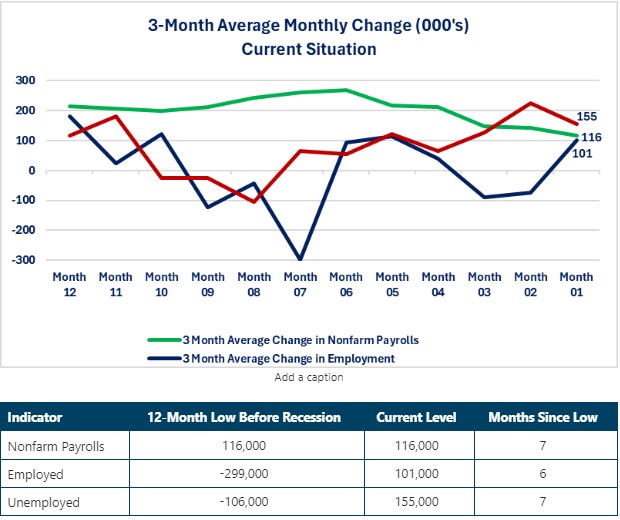
SVP, Chief Investment Officer and Economist There will not be an Economic Perspectives next week as I will be out of the office for the majority of the week. Economic Perspectives will resume on 9/20/24. The Economic Perspectives newsletter is comprised entirely of the expertise, thoughts, perspectives and opinions of the author with no use of generative AI. Data is sourced from the original providers (typically government agencies) and analyzed by the author. It appears that the Federal Reserve was spooked by the weaker than expected jobs report for July and the major downward revision to the jobs data covering the period from April 2023 to March 2024. Chairman Powell was clear during a speech he gave two weeks ago that the Federal Reserve has shifted from solely focusing on inflation to now focusing on both inflation and the labor markets. Today's perspectives examines the labor markets. The Federal Reserve has made it clear that it is now shifting its focus to labor market conditions in addition to its focus on inflation. Comparing current levels of labor market indicators to the levels that existed before the start of recessions since 1980 provides insight into why the Federal Reserve has become concerned about labor market conditions. Although the financial markets and economists focus on the monthly jobs report, it is the trend and current levels that exist for the employment and unemployment data series that are the cause for concern. No matter what data series you look at, it is important to remember that the labor force data series are not leading indicators. They are coincident indicators which means that they are their worst when a recession is actually occurring. Two out of the three labor market indicators are now worse than the average level that existed for the past five recessions since 1980. The average low for the three-month average monthly change in nonfarm payrolls was 17,000 jobs added. The average length of time before the recession started after the low occurred was 6.6 months. The level for the three-month average that existed one month before the recession started was 102,200 jobs added. The current three-month average (as of 8/31/24) is 116,000. The average low for employment was a decrease of 101,600 jobs. The average length of time before the recession started after the low was 7.0 months. The level that existed one month before the recession started was a 107,800 increase in employment. The current three-month average is 101,000. The average low for unemployment was a 126,200 decrease in the number of people unemployed. The average length of time before the recession started after the low was 6.8 months. The level that existed one month before the recession started was a 144,400 increase in the number of unemployed. The current three-month average is 155,000. Even though the media and financial markets focus on the jobs data, the area that should concern the Federal Reserve is the employment and unemployment data. All data is from the Bureau of Labor Statistics (BLS) as of 8/31/24. Three labor market data series published as part of the monthly Employment Situation report are used in this analysis. Monthly change in nonfarm payrolls (i.e. number of jobs added in a month) Monthly change in employment levels (i.e. number of people stating that they became employed). Monthly change in unemployment levels (i.e. number of people stating that they became unemployed). In order to reduce the “noise” of the monthly numbers, all analysis uses a three-month average. The two-month recession related to the pandemic crisis has not been included given the massive distortions related to that period. There have been five recessions since 1980. January 1980-January 1981 July 1981-November 1982 July 1990-March 1991 March 2001-November 2001 December 2007-June 2009 There is not a clear declining trend in jobs or employment in the twelve months leading up to the recession and there is not a clear rising trend for the level of unemployment. During the twelve-month period before the recession, the three-month average for jobs fell for three months but was rising when the recession hit. Employment showed a clear decline for two months but was moving within a range when the recession hit. The number of unemployed rose for three months but then declined and had only shown one month of increase before the recession started. It is important to understand that the 1981 recession occurred shortly after the 1980 recession ended. The effects from the 1980 recession had not fully worn off before the 1981 recession began. Some economists argue that the 1981 recession was really a continuation of the 1980 recession. There was a clear variance between the data sets as to length of time from the low until the recession started with the employment data showing the shortest time and the jobs data showing the longest. Both the jobs and employment data series were only showing two months of decline. The unemployment series rose was declining for three months before rising and then leveling off. Both the jobs and employment data series were rising leading into the recession with the employment series showing a large increase in employment. The unemployment series was trending down for four months until tipping back up the month before. When you average all five recessions there is a bit more of a trend evident. Each of the three data series showed signs of a trend five to six months before a recession. Each data series showed the start of a trend, a temporary reversal and then a resumption of the trend. The nonfarm payroll data series is the only one showing a clear downward trend. The unemployment data series was showing a clear rising trend until August. The employment data does not show a clear trend. The current employment level is worse than the average for the past five recessions. The current unemployment level is worse than the average for the past five recessions. The current nonfarm payroll level is barely better than average for the past five recessions. If the Federal Reserve has now shifted its focus to the labor markets, it has an unenviable job of trying to determine the health of the labor market in this economic cycle. Most of the labor market indicators are not leading indicators. August's employment report showed the number of employed people rose and the number of unemployed people fell. Even the labor data series that has been a leading indicator (initial jobless claims) has been questionable for assessing the health of the labor market. Initial jobless claims gave a false signal in 2023. Given the fact that virtually all of the historically accurate leading indicators for a recession have proven inaccurate for this economic cycle, The Federal Reserve has to be cautious viewing the labor market indicators. First, as discussed above, they are coincident indicators not leading indicators so they will not give any advance warning of a recession. Second, since two of the three data series have current levels that are worse than the month before previous recessions, it appears that these coincident indicators are also proving to be inaccurate for this business cycle. Even the monthly report from the Federal Reserve districts (i.e. “The Beige Book”) is in conflict with the policy committee's views. The Federal Reserve policy committee believes that the labor markets are weakening. That should mean layoffs are rising. The Beige Book reported that layoffs were rare throughout the Federal Reserve districts. The best explanation that I can give as to why the Federal Reserve believes that labor market conditions warrant lowering interest rates when inflation is still a work in progress is that it worries that a “broken dam” effect may occur. By that I mean the Federal Reserve may worry that businesses have not been following the path towards layoffs as fast as they did historically. Instead, the fear is that businesses are job hoarding as long as possible because of how hard it was to fill jobs. The worry may be that if the economy starts to slow more rapidly, the “dam” may burst, and layoffs happen swiftly and potentially in bigger sizes as the job hoarding ends. If that is the Federal Reserve's thought process than this is one of the rare times when the Federal Reserve may be moving proactively. In financial market lingo, that would be characterized as “being ahead of the curve” versus the normal criticism that the Federal Reserve is “behind the curve”. It is clear that reductions in the overnight borrowing rates are coming in September. The question is how much and how fast. A 0.25% reduction would be the cautious approach. It signals that rate increases are over but that the Federal Reserve will continue to monitor the inflation data before making additional reductions. It also helps keep the Federal Reserve from being accused of basing its decisions on politics. A 0.50% reduction would be an aggressive approach. It risks signaling that the Federal Reserve believes the economy is worse than what the economic data is showing. That could create a self-fulfilling prophecy where businesses and consumers think “the Fed must know something I don't know” and start changing their spending behavior. It risks re-stimulating the economy and triggering inflation to rise again. This would be a version of the mistake that the Federal Reserve made in 1981 that resulted in two rising rate cycles and two recessions with a three-year time span. It risks the Federal Reserve being accused of making a political decision rather than an economic decision. I continue to advocate that you believe what you see happening with your business, customers and prospects if you want the best leading indicator on what the economy is truly doing. Data Time Period Being Reported Current Previous Comments 9/3/24 S&P Global Manufacturing PMI August 47.9 49.6 Manufacturing continued to decline in this version of the PMI report. ISM Manufacturing PMI August 47.2 46.8 Manufacturing showed a slight improvement in this version of the PMI report. Construction Spending July -0.3% 5.0% Commercial and residential construction were both down 0.4% while public construction was up 0.1% 9/4/24 MBA Mortgage Applications Weekly Change 8/30/24 1.6% +0.5% All of the improvement came from an increase in the number of people applying to buy a home. 8/30/24 3.3% +1.0% Lower mortgage rates encouraged some buyers to enter the market. 8/30/24 -0.3% -0.1% Refinancing activity remains around the unchanged level as mortgage rates have not declined enough to spur another wave of refinancing Trade Balance Monthly Change July -78.8B -73.0B The widening of the trade deficit will be a drag on US economic growth. July $266.6 Billion $265.9 Billion Exports rose by $600 million. July $345.4 Billion $339.0 Billion Imports rose by $6.4 billion. Factory Orders Year-Over-Year Change July +5.0% -3.3% Factory orders rebounded back into positive territory but, orders remains volatile. JOLTS Job Openings July 7,673,000 7,910,000 Businesses posted less job openings than in June. 9/5/24 Challenger Jobs Cuts Year-Over-Year Change August 1.0% 9.2% Announced layoffs slowed compared to July and are approaching the unchanged level. ADP Nonfarm Payrolls Monthly Change August 99,000 111,000 Jobs growth fell below 100,000 in ADP's version of the national nonfarm payroll number. Initial Jobless Claims Weekly Change 8/31/24 227,000 232,000 Initial claims fell by 5,000 as it appears that people being laid off are finding new employment quickly. Continuing Jobless Claims Weekly Change 8/24/24 1,838,000 1,860,000 Continuing claims fell by 22,000. Nonfarm Productivity Annualized Quarter-Over-Quarter Change 2nd Quarter 2.5% +0.2% Businesses were more productive as output increased 3.5% while hours worked only increased 1.0%. 2nd Quarter 3.0% 4.0% Compensation costs continue to slow. S&P Global Services PMI August 55.7 55.0 Service sector activity increased slightly. ISM Non-Manufacturing PMI August 53.3 54.5 ISM's version of service sector activity showed slowing. 9/6/24 Nonfarm Payrolls Monthly Change August 142,000 89,000 We continue to see the Bureau of Labor Statistics revise previous month's data lower. What will August real number be? Average Hourly Earnings Year-Over-Year Change August 3.8% 3.6% The Federal Reserve wants further slowing not acceleration. Average Weekly Earnings Year-Over-Year Change August 3.5% 3.4% Same story as average hourly earnings. Unemployment Rate August 4.2% 4.3% The number of employed people rose while the number of unemployed fell. Economic Data Time Period Being Reported What was the Result? What was the Previous Result? Comments 4/29/24 Dallas Federal Reserve Manufacturing Index April -14,5 -14.4 Essentially unchanged from March. 4/30/24 Employment Cost Index Annualized Change 1st Quarter +1.2% +0.9% Wage increased surprised to the upside similar to inflation increases. FHFA Home Price Index Year-Over-Year Change February +7.0% +6.5% This is two-month-old data but still shows home prices rising. S&P Core Logic Home Price Index Year-Over-Year Change February +7.3% +6.3% Same trend as the FHFA results. Chicago Purchasing Managers Index (PMI) April 37.9 41.4 Continued evidence of manufacturing sector activity contracting. Conference Board Consumer Confidence Index April 97.0 103.1 Rising food costs and gas prices were the primary reason for the decline in confidence. April 142.9 146.8 The drop is not as big as the Future Expectations result. April 66.4 74.0 Consumers are more worried about the future than their present situation. Dallas Federal Reserve Service Sector Activity Index April -10.6 -5.5 The Texas region is one of the few regions where both the Manufacturing and Service Sector activity is contracting. 5/1/24 Mortgage Applications Weekly Change 4/26/24 -3.3% -2.7% Applications continue to decline. 4/26/24 -2.0% +5.0% The rush to lock in a mortgage rate appears to have run its course. 4/26/24 -3.0% +0.50% The continued rise in rates caused refinance activity to decline. ADP Payroll Employment April +192,000 +208,000 Jobs growth slowed slightly but still remains solid. Construction Spending April -0.2% -0.3% Little change from March. S&P Global Manufacturing PMI April 50.0 51.9 Activity slowed but just barely remained positive. ISM Manufacturing PMI April 49.2 50.3 The ISM version of PMI fell below 50 and is now in contraction mode. Job Openings and Labor Turnover Survey (JOLTS) April 8,488,000 8.813,000 Job openings declined by 325,000. 5/2/24 Challenger Job Cuts Year-Over-Year Change April -3.3% +0.7% Jobs cuts declined in April after barely increasing in March. Trade Balance March -$69.4 billion -$60.5 billion The trade balance was basically unchanged. Initial Jobless Claims 4/27/24 208,000 208.000 No change from the previous week. Continuing Claims 4/20/24 1,744,000 1,774,000 Decreased 30,000 Nonfarm Productivity Annualized Rate 1st Quarter +0.3% +3.5% This is the weakest growth since 1st quarter 2023. Unit Labor Costs Annualized Rate 1st Quarter +4.7% -0- This will not give the Federal Reserve any comfort as employers will most likely try to pass this increased cost through to the final buyer. Factory Orders Monthly Change March +1.6% +1.2% This was the second consecutive month of an increase. March +0.5% +1.2% Order growth slowed but remained positive. 5/3/24 Growth of Nonfarm Payrolls Monthly Change April 175,000 303,000 First signs of jobs growth showing fatigue. Labor Force Participation Rate Monthly Change April 62.7% 62.7% No change Unemployment Rate April 3.9% 3.8% Inching towards 4.0% Average Weekly Earnings April 3.9% 4.1% This will probably be welcome news for businesses and the Federal Reserve but, disappointing new for the average worker. ISM Non-manufacturing PMI April 49.4 51.4 The service sector has now slipped into contraction based on this index. S&P Global Services PMI April 51.3 51.7 S&P Global's service index has not yet slipped into contraction territory.Please Note:
Content Authenticity Statement:
Perspectives
Two Minute Sound Bite
Summary
Observations
1980 Recession
1981 Recession
1990 Recession
2001 Recession
2007 Recession
Average of Five Recession Since 1980
Current Situation
Closing Thoughts
Economic Data
Lorem Ipsum has been the industry's standard dummy text ever since the 1500s, when an unknown printer took a galley of type and scrambled it to make a type specimen book.
It has survived not only five centuries, but also the leap into electronic typesetting, remaining essentially unchanged.
Lorem Ipsum is simply dummy text of the printing and typesetting industry.
Enjoy our meals. You can click each menu to display more information.