Enjoy the experience of our restaurant.
Register to know our latest news.
Lorem ipsum dolor sit amet, consectetur adipiscing elit, sed do eiusmod tempor incididunt.
Lorem ipsum dolor sit amet, consectetur adipiscing elit, sed do eiusmod tempor incididunt.
Lorem ipsum dolor sit amet, consectetur adipiscing elit, sed do eiusmod tempor incididunt.
Lorem ipsum dolor sit amet, consectetur adipiscing elit, sed do eiusmod tempor incididunt.
Steve Scranton
SVP, Chief Investment Officer and Economist
Perspectives
For those of you who are long-time readers of this newsletter or who have heard me give economic presentations, you know that I examine the economy through the lens of jobs. My logic is that since consumer spending has been the engine that has driven this economy, we need to understand where the average consumer derives their income. Based on the most recent data from the Bureau of Economic Analysis (BEA), wages and salaries make up 52% total personal income. For the average worker that percentage is probably higher since they do not have rental properties or an investment portfolio that generates income for them. So, the chain of events that leads to consumer spending is, first, jobs are created. That generates wages and salaries. Wages and salaries are then used to fuel consumer spending.
So, if job creation is a critical part of economic growth, loss of jobs is a critical factor in slowing economic growth and potentially causing a recession. Thus, if we are trying to monitor factors that may change the current growth of the economy, monitoring job losses is important. In general, when someone loses their job, they will file for unemployment benefits if they qualify. The Department of Labor provides a weekly report on filings for unemployment benefits. Since “filing for unemployment benefits” is a mouthful, it shortens the term to jobless claims. There are two types of jobless claims: initial claims and continued claims. Initial claims measure the number of people making their initial application for unemployment benefits. Continued claims measure the number of people who continue to file for unemployment benefits following their initial claim. If you remain unemployed, you continue to file for claims.
To me, each type of claim serves a different role in monitoring the potential impact to the economy. Jobless claims help us understand when businesses start laying off employees but it does not tell us whether that is a sustained hit to the economy. If someone quickly finds work, then the impact may be minor. Continued claims tell us if more and more people are having trouble finding work and need continued unemployment benefits. That helps us monitor the potential for a sustained impact to the economy.
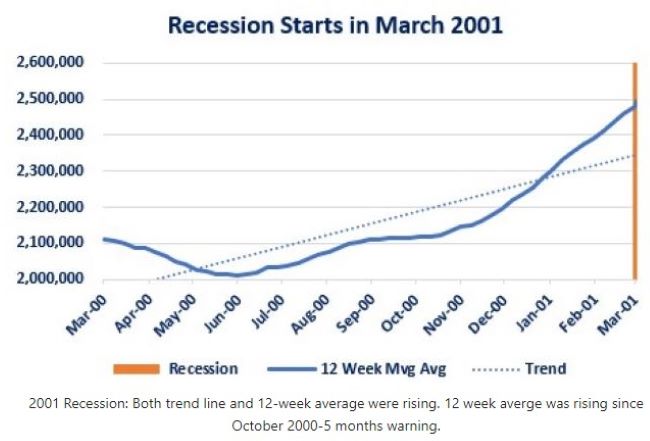
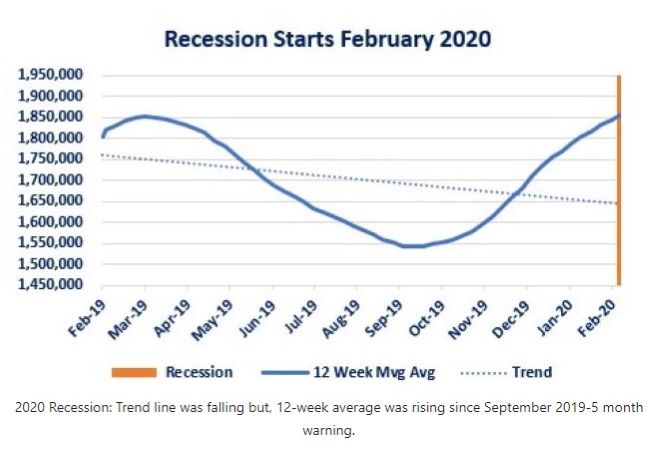
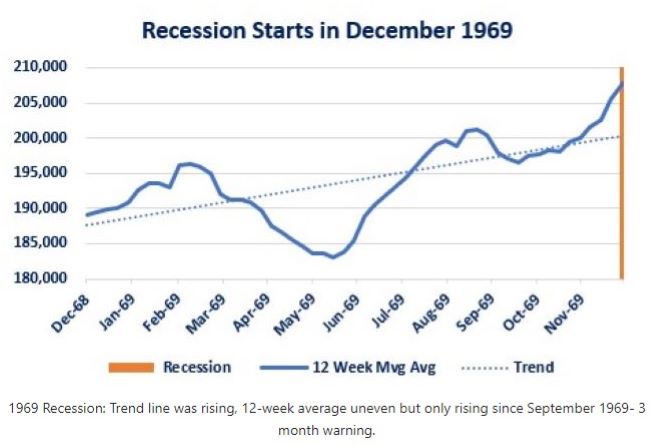
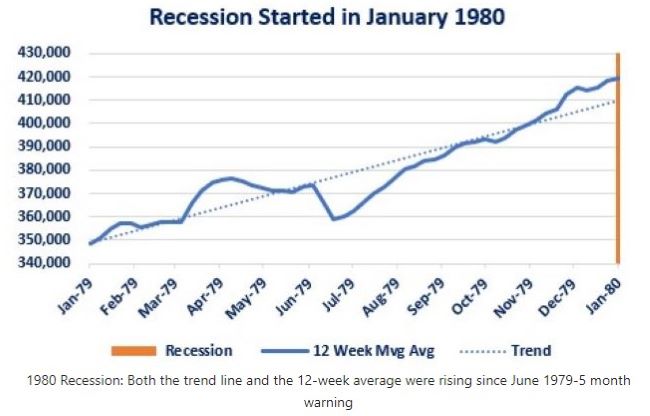
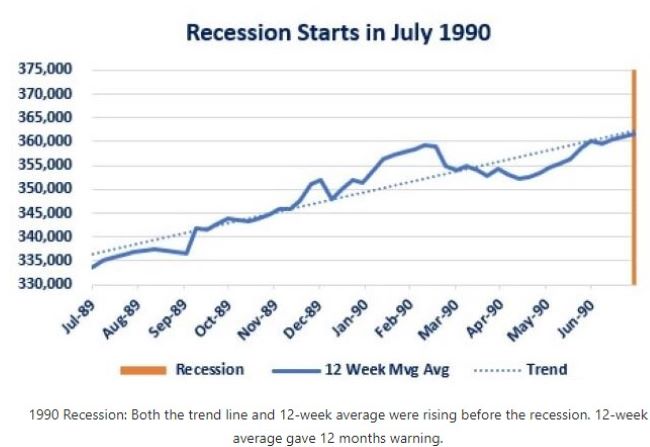
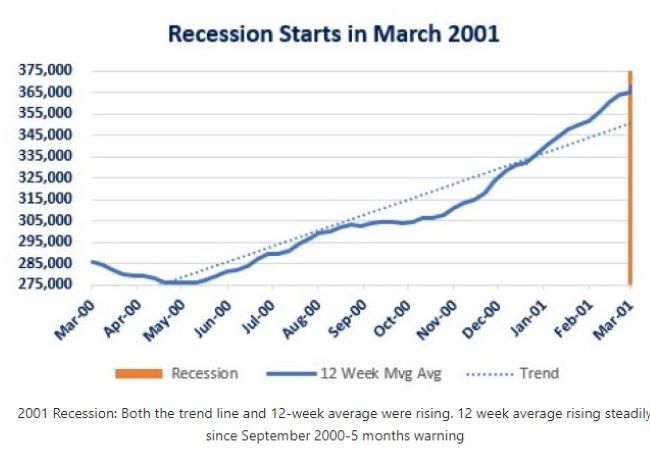
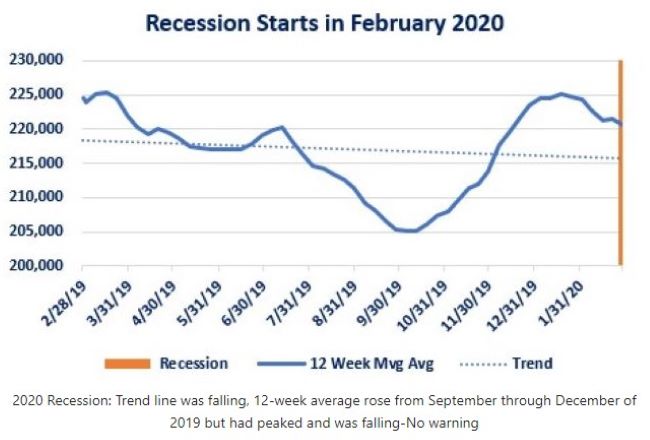
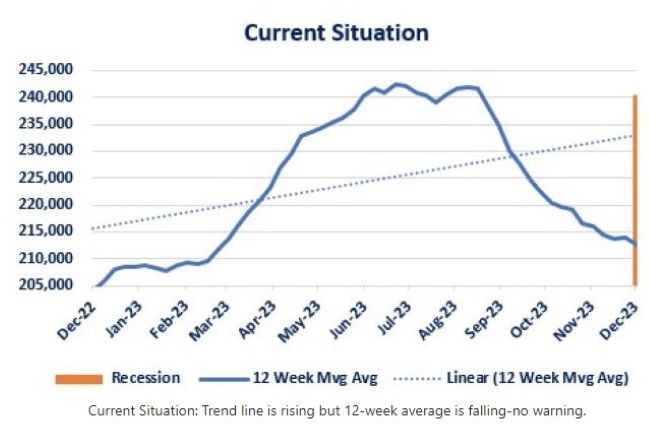
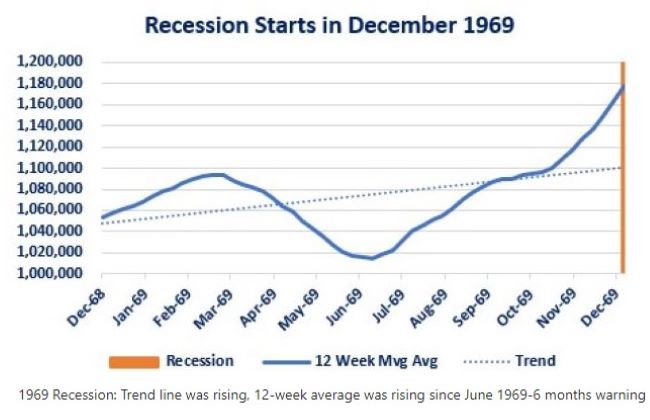
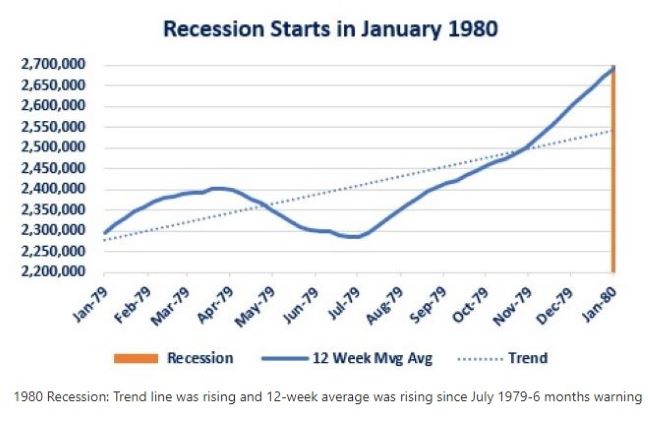
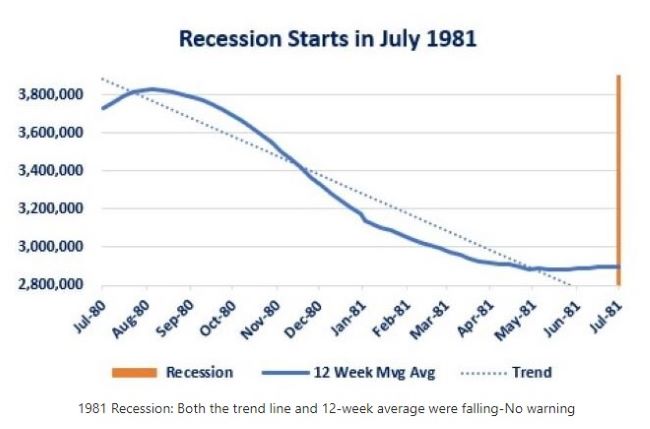
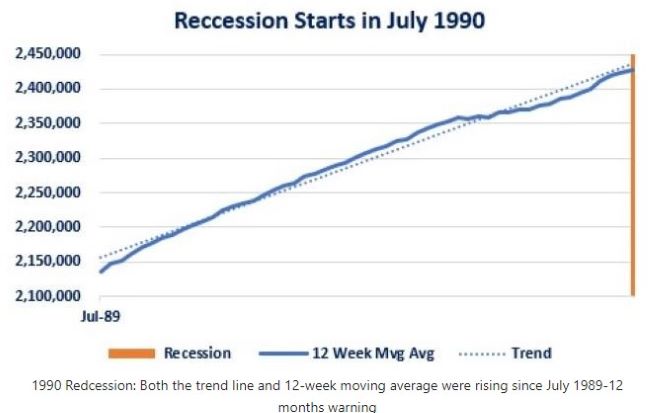
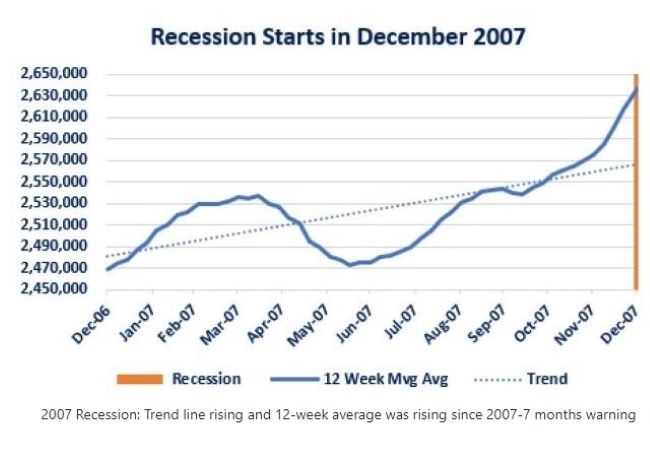
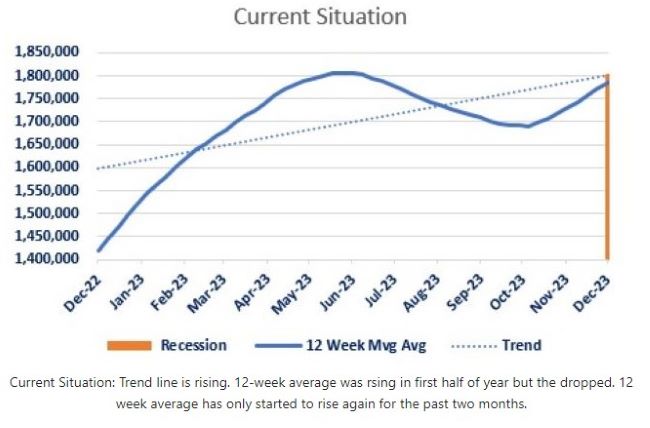
This week, I am going to provide analysis on both initial and continued claims with regards to whether the data provides warning signs in advance of a recession.
Since there have been eight recessions since 1964, that mean 16 graphs. As a result, I am once again going to attempt avoid having this newsletter drag on forever. I will provide the graphs with minimal commentary and then provide more commentary in the Closing Thoughts sections.
=================================================================================
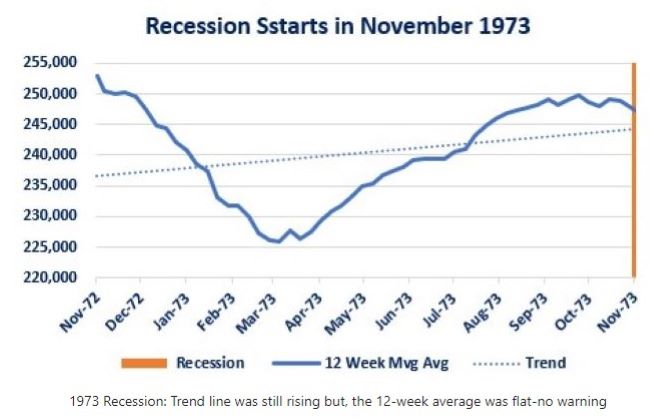
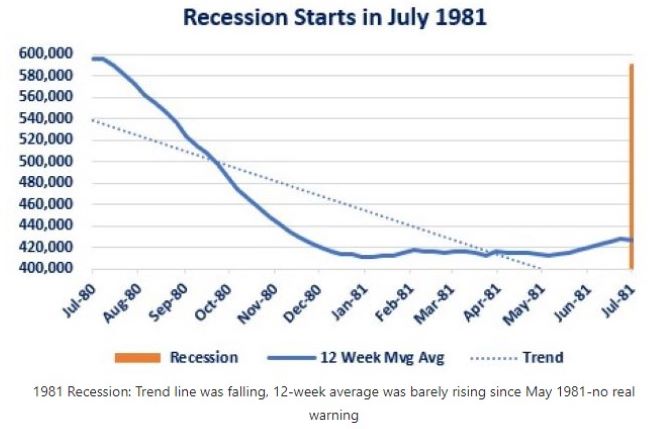
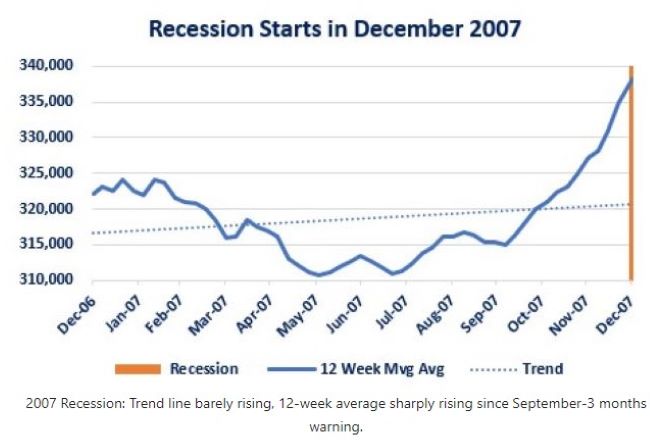
Initial Claims
==========================================================================
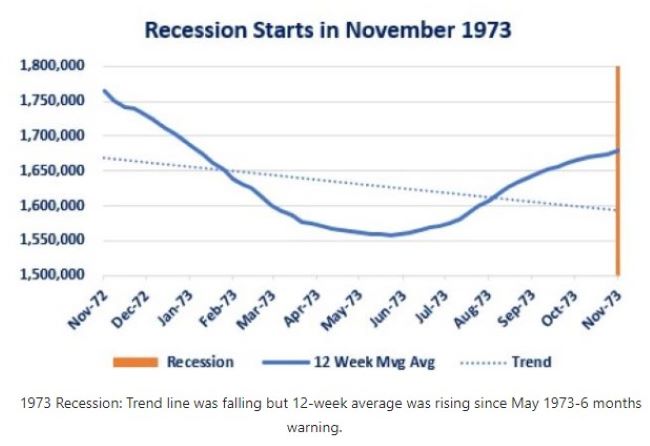
Continued Claims
Note:
I have changed the format for the Economic Data. My goal is to find ways to present in information in an understandable format while striving to keep it in a concise form. As a result, I have converted this section to a table. This will also reduce the number of pages for the newsletter!
| Economic Data |
As of When? |
What Was The Result? |
What Was Previous? |
Comments |
| NFIB Small Business Optimism | November | 90.6 | 90.7 | Lack of qualified help is the biggest challenge. |
| Consumer Price Index Year-Over-Year | November | +3.1% | 3.2% | Slow progress |
| Core CPI- Year-Over Year | November | +4.0% | 4.0% | No progress |
| Producer Price Index Year-Over-Year | November | +0.9% | 1.2% | Steady progress |
| Core Producer Price Index Year-Over-Year | November | +2.0% | 2.3% | Not necessarily being passed on to the final price of the product. |
| Mortgage applications-Total | 12/8/23 | +7.4% | +2.8% | 6th straight week of increases. |
| Mortgage applications-Refinance | 12/8/23 | Increased 19.4% | N/A | Falling mortgage rates stimulated people to refinance |
| Mortgage application-Purchase | 12/8/23 | Increased 3.5% | N/A | Falling mortgage rates stimulated demand. |
| Initial Jobless Claims | 12/9/23 | 202,000 | 221,000 | Fell 19,000 |
| Continued Jobless Claims | 12/2/23 | 1,876,000 | 1,856,000 | Rose 20,000 |
| Retail Sales Year-Over-Year | November | +4.09% | +2.2% | Remember, this data is not adjusted for inflation. |
| Import Prices Year-Over-year | November | -1.4% | -1.8% | Benefits US businesses that import products. |
| Export Prices Yer-Over-Year | November | -5.2% | -4.7% | Bad for US businesses that export products. |
| New York Federal Reserve Manufacturing Activity Index | December | -14.5 | +9.1 | This has been a volatile index with large monthly swings. |
| Industrial Production | November | 0.2% | -0.9% | Led by rebound in auto production after conclusion of UAW strike. |
| S&P Global Manufacturing Index | December | 48.2 | 49.4 | Manufacturing continues to report activity is contracting. |
Lorem Ipsum has been the industry's standard dummy text ever since the 1500s, when an unknown printer took a galley of type and scrambled it to make a type specimen book.
It has survived not only five centuries, but also the leap into electronic typesetting, remaining essentially unchanged.
Lorem Ipsum is simply dummy text of the printing and typesetting industry.
Enjoy our meals. You can click each menu to display more information.