Enjoy the experience of our restaurant.
Register to know our latest news.
Lorem ipsum dolor sit amet, consectetur adipiscing elit, sed do eiusmod tempor incididunt.
Lorem ipsum dolor sit amet, consectetur adipiscing elit, sed do eiusmod tempor incididunt.
Lorem ipsum dolor sit amet, consectetur adipiscing elit, sed do eiusmod tempor incididunt.
Lorem ipsum dolor sit amet, consectetur adipiscing elit, sed do eiusmod tempor incididunt.
Steve Scranton
SVP, Chief Investment Officer and Economist
A strong labor force participation rate coupled with a low unemployment rate is typically seen as a sign of strength for the labor market. If the participation rate begins to trend downward, it means that there are fewer people contributing to the nation’s output of goods and services. Unless there are offsetting productivity gains, this is a drag on economic growth. As such, this is an important consideration when thinking about the health of the national economy.
For this week’s Economic Perspectives, I thought it would be interesting to expand upon what the labor force participation rate is, what affects it, how it’s related to unemployment, and where we stack up in relation to our global peers.
What is the Labor Force Participation Rate?
The labor force participation rate (LFP) is defined as the percentage of our civilian population who is of working age (16-75) that is either currently working or actively looking for work. In the US, LFP is measured by the Bureau of Labor Statistics (BLS). Because I will be looking at global metrics, I utilized the World Bank, which has aggregated global LFP by country as current as the end of 2022.
What affects the LFP Rate?
Many factors have an impact on the LFP — gender, education, fertility rate, ethnicity, marital status, and migration just to name a few. Social and cultural norms come into play as well, as in who in a community is expected to work? There are also demographic factors (young vs. old) at play as well as economic factors (how industrialized and/or affluent is the population?), — i.e., is there a part of the population that does not need to work?
Where does the US stand in terms of our LFP?
As of November, the US labor force participation rate is 62.8. For the sake of perspective, the US labor force participation rate’s long-time running average (1948-2023) is also 62.8. This compares to an all-time high of 67.3 reached in January of 2000.
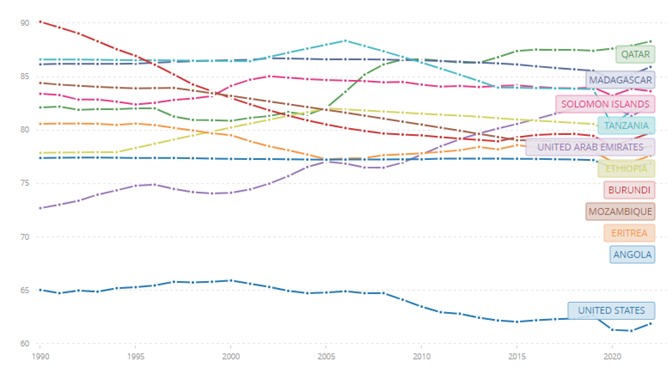
What might surprise you, however, is that the US LFP rate does not rank that high in terms of the global economy. In fact, according to the World Bank, at the end of 2022 the US LFP rate ranked 92nd at only 62 and just behind Slovakia and the UK. The country with the highest labor force participation rate is Qatar at 88. What’s interesting to me is that even at our peak rate of 67, the US is nowhere near the top. In fact, we’d land at 39th, just behind Mali.
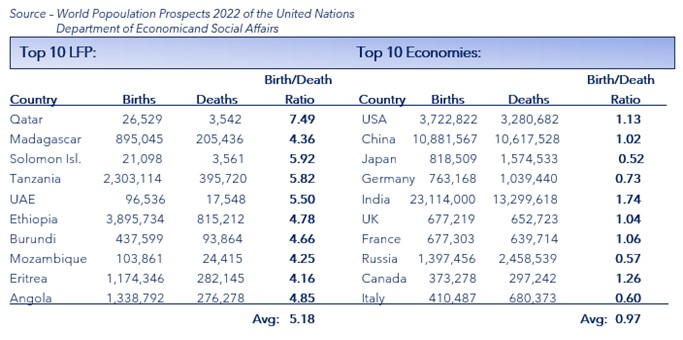
So this begs the question, which countries are at the top? As of the end of last year, the top ten countries in terms of labor force participation were Angola, Eritrea, Mozambique, Burundi, Ethiopia, United Arab Emirates, Tanzania, Solomon Islands, Madagascar, and Qatar — all of which are emerging or developing economies according to the International Monetary Fund (IMF).
What’s interesting to me is that it isn’t until you get down to number 13 on the World Bank’s list that a developed country appears. In this case it’s Iceland, with a LFP rate of 75. What’s more, only 23 advanced economies appear on this list ahead of the US.
Admittedly, the top ten in terms of LFP on this list are pretty small countries — economically speaking.
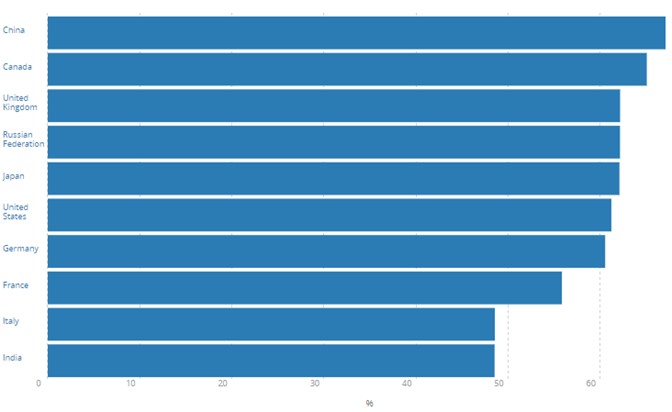
Because of this, I wondered which countries would surface if I sorted the list by economic size via gross domestic product (GDP). An obvious change in economic status (emerging vs. developed) emerges. Given that each of the economies is much larger than in the first sample, the majority that appear in this top ten are considered advanced or developed. In fact, only three emerging countries appear: China, India, and Russia. Also of interest is that on this list, LFP ranges from 49 (India) to 67 (China). So, the countries on this list with both the lowest and the highest LFP are considered emerging.
As I considered possible differentiating factors between these two lists, I immediately thought of fertility rates and median ages. I considered this first, because more than a few of the countries (US, China, and Japan) on the top 10 economies list have been making headlines over the last few years due to declining fertility rates coupled with aging populations. In a vacuum, if there are fewer births, there will be fewer people to fill the jobs that the existing work force is aging out of. Obviously, that will negatively impact LFP.
With all of this in mind, I wondered what the fertility rate and median age of each of the countries were in these two lists: (Top 10 LFP) and (Top 10 Economies)
Note: the fertility rate is defined by the Organization for Economic Co-operation and Development (OECD) as the average number of children that are born to a woman over her lifetime. A total fertility rate of 2.1 children per woman ensures a broadly stable population. Another way to look at this, is that a fertility rate of 2.0 or higher would be considered “replacement level fertility” — meaning the two children replace both the mother and father.
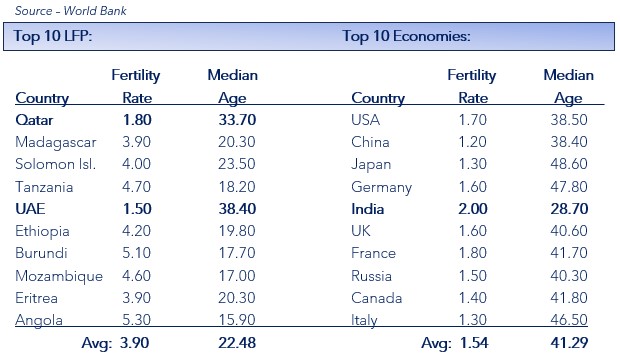
With a few exceptions, the difference is undeniable. The top 10 countries in terms of LFP have a high fertility rate coupled with a youthful population. Compare that to the 10 largest economies which, on average, have a fertility rate below replacement level, coupled by a much higher median age.
To me, the most notable exceptions between these two lists are India and then both Qatar & UAE.
India has a relatively high fertility rate, coupled with a low median age versus the others on the list. Surprisingly, India’s LFP rate is only 49. They are also ranked at a lowly 161 on the World Bank’s list. As I began to look into possible factors that would constitute a drag on LFP, one clear contributing factor stood out - lack of women in the workforce. According to the World Bank, at the end of 2022, the ratio of women in India’s workforce was only 24%. Compare that to the US and China at 56% and 61% respectively.
UAE and Qatar, on the other hand, each have fertility rates that are well below replacement level coupled with median ages that are in-line with the top 10 economies. By those metrics alone, one might easily conclude these two countries would be battling the same demographic drags that weigh on LFP in much of the developed world. Once again, Qatar is ranked as #1 in terms of LFP at 88 and of notable mention, also claims the top spot in terms of unemployment at only 0.1%. UAE’s LFP is ranked at #5 with a rate of 82.
So, what’s different about these two countries – especially when you compare them to larger developed countries with similar fertility rates and median ages? The first thing I discovered is that each of these countries have a relatively high female LFP - with Qatar at 62 and UAE at 53. It’s important to keep in mind that this is an anomaly in the Middle East as women make up only 19% of the workforce within the region.
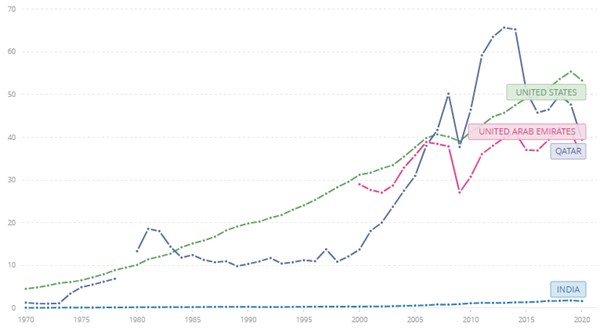
Also, relatively unique to both Qatar and UAE, is that they have strong economies driven by petroleum and natural gas production. As of the end of 2022, each boasted annual GDP of 4.80% and 7.40% respectively. Oil production over the last several decades has also allowed each of these countries to build out new infrastructure and rapidly diversify their economies — attracting new talent (immigration) in search of new opportunities. Along these lines, adjusted net national income per capita is relatively high for both Qatar ($39,483/yr) and UAE ($35,542/yr), especially in the context of the US ($53,327/yr) and India ($1,663/yr).
Finally, as I thought about the fertility rates between the two lists and considered the median ages (younger for the top 10 LFP and older for the top 10 economies) I wondered what the birth to death ratio for each country might look like. A population that has more births than deaths is obviously growing, whereas a population that has more deaths than births is arguably in decline — that is unless there is healthy immigration. Because of this, I reviewed the 2021 birth to death ratio for each of these two lists:
Reflecting back on the multiple factors that have an impact on LFP, fertility, gender, demographics, among other factors, absolutely matter. Generally speaking, emerging economies will have younger populations, and as long as their fertility rate remains high, they will likely continue to maintain a larger workforce and as a result – higher LFP. Compare that to what we’re observing in the developed areas, which is fewer births coupled with a large portion of the population that is quickly aging out of the workforce or worse, general population.
Of mention is Russia’s birth to death ratio. As of the end of 2022, it is already one of the lowest in the world at 0.57. The war in Ukraine will likely drive that ratio much lower. According to the U.K. Ministry of Defense, Russia has suffered significant casualties from the onset of the War. As of November 2023, Russia has suffered approximately 240,000 wounded and as many as 50,000 killed. An additional and interesting twist to this is that it is believed that since the start of the war (according to population data from recipient countries), as many as 820,000 to 920,000 Russian citizens have fled the country seeking asylum elsewhere. It goes without saying that this will likely have long-lasting ramifications on their culture, economy, and population.
Labor force participation is clearly unique to each country, culture, and economy. In this edition of Economic perspectives, I have simply scratched the surface while focusing primarily on birth rates and cultural differences – such as female participation. There is clearly an abundance of opportunity to write several other follow up editions with a focus on how family formation, immigration (population inflows), emigration (population outflows), income, climate change, and technology also impact the labor market.
What I hope to leave you with this time around is the clear observation that LFP continues to lag in the developed areas of the world as their populations age and fertility rates decline. I would also like to leave you with a few thoughts as to how those countries with a low LFP might find ways to improve it. This is with the caveat that there is no silver bullet or “one size fits all solution”. Every country has its own set of problems that are unique to its own population, economy, and culture.
Establishing a culture where all jobs are considered to be both honorable and important may help convince people to take on jobs that are currently not viewed favorably or of value by many in developed societies. Part of that cultural change requires parents nurturing and supporting their children to pursue their passion rather than pursuing jobs that the cultural climate deems as acceptable.
Access to education has a positive impact on the labor force. It better ensures that people can find jobs that pay enough to support a family and provide economic stability. It also means that people have a better chance of evolving with the labor market.
Income inequality is a slippery slope as it reduces productivity and erodes social cohesion. If workers are increasingly unable to afford basic living expenses, they will have a difficult time focusing on their job.
As mentioned earlier in regard to both Qatar and UAE, industrialization creates opportunities in the form of new jobs in new industries, coupled with higher wages.
Effective immigration reform means distinguishing between different types of immigration with potentially different rules for each. Some types of immigration are needed, others are discretionary and up to each country to decide how much of this type of immigration should be allowed, given resource constraints. Other types are illegal immigrants who, by definition (i.e., illegal), should not be allowed to immigrate. Some, examples, but not all, include:
Summary of Economic Data
| Economic Data | As of When? |
What Was the Result? |
What was Prior? |
Comments |
| New York Fed Services Business Activity | December |
-14.6 |
-11.9 |
Declined further |
| NAHB Housing Market Index | December |
37 |
34 |
First gain in five months |
| Housing Starts | November |
1.56 million |
1.359 million |
Higher on lower mortgage rates and low inventory |
| Housing Starts MoM | November |
14.80% |
1.90% |
Highest in six months |
| Building Permits | November |
1.46 million |
1.498 million |
Fewer multi-family permits |
| Building Permits MoM | November |
-2.50% |
1.80% |
Lower |
| MBA Mortgage Applications | 12/15/23 |
-1.50% |
7.40% |
First pullback in six weeks. |
| Current Account Balance | 3rd QTR |
$-200.3 billion |
$-216.8 billion |
Smallest shortfall since QTR2 of 2021 helped by export activity |
| Existing Home Sales MoM | November |
0.80% |
-4.10% |
First gain in five months |
| Conf. Board Consumer Confidence | December |
110.7 |
102 |
Five-month high |
| Conf. Board Present Situation (sub-index) | December |
148.5 |
138.2 |
Better short-term outlook |
| Conf. Board Expectations (sub-index) | December |
85.6 |
77.8 |
Above 80, which is a level historically associated with a recession in the next year |
| GDP Annualized QoQ | 3rd QTR |
4.90% |
5.20% |
Slowed, but still strong |
| GDP Price Index | 3rd QTR |
3.30% |
3.60% |
Prices eased |
| Personal Consumption | 3rd QTR |
3.10% |
3.60% |
Spending on services declined |
| Initial Jobless Claims | 12/16/23 |
205,000 |
203,000 |
Rose 2,000 |
| Continuing Claims | 12/09/23 |
1.865 million |
1.866 million |
Fell 1,000 |
| Philadelphia Fed Business Outlook | December |
-10.5 |
-5.9 |
17th negative reading out of 19 months |
| Leading Index | November |
-0.50% |
-0.80% |
Lower |
| Kansas City Fed Manf. Activity | December |
-1 |
-2 |
Little changed |
| Personal Income | November |
0.40% |
0.30% |
Wages outpaced investment income |
| Personal Spending | November |
0.20% |
0.10% |
Spending on services outpaced goods |
| PCE Deflator MoM | November |
-0.10% |
0.00% |
First decline since February of 2022 |
| PCE Deflator YoY | November |
2.60% |
2.90% |
Lowest since February of 2021 |
| PCE Core Deflator MoM | November |
0.10% |
0.10% |
Below expectations of climbing 0.20% |
| PCE Core Deflator YoY | November |
3.20% |
3.40% |
Extended disinflationary trend |
| Durable Goods Orders | November |
6.50% |
-6.40% |
Biggest gain since 2020 led by transportation equipment. |
| Durables Ex Transportation | November |
0.50% |
-0.30% |
Gains seen in manufacturing |
| New Home Sales | November |
590,000 |
679,000 |
Sales were worst in the South and in the West |
| New Home Sales MoM | November |
-12.20 |
-4.00% |
Sharpest decline since April of 2022 |
| U. of Mich. Sentiment | December |
69.7 |
61.3 |
Better. Highest in five months on lower inflation expectations. |
| U. of Mich. Expectations | December |
67.4 |
56.8 |
Also better |
| U. of Mich. Current Conditions | December |
73.3 |
68.3 |
Better |
| U. of Mich. 1 Yr Inflation | December |
3.10% |
4.50% |
Near a three-year low on falling energy costs |
| U. of Mich. 5-10 Yr Inflation | December |
2.90% |
3.20% |
Lorem Ipsum has been the industry's standard dummy text ever since the 1500s, when an unknown printer took a galley of type and scrambled it to make a type specimen book.
It has survived not only five centuries, but also the leap into electronic typesetting, remaining essentially unchanged.
Lorem Ipsum is simply dummy text of the printing and typesetting industry.
Enjoy our meals. You can click each menu to display more information.